Using MasterDATACSV
Composite Breadth Data In Excel
Using MasterDATACSV
Composite Breadth Data In Excel
|
|
Once
downloaded, the most efficient way
to use our .csv composite datafiles
on a regular basis is to leave them
as is and to instead link them to
an Excel (.xls) spreadsheet.
With both the .csv datafile and
.xls spreadsheet opened from within
the same directory (open the .csv
file first then the .xls file),
each cell in the spreadsheet links
directly to a cell in the downloaded
.csv datafile.
This
.xls spreadsheet is where you will
do your calculations. On subsequent
downloads, therefore, your work
will not be overwritten when you
update your data. Save each
of your own .xls spreadsheets with
its own unique name (usually just
the symbol) in the same directory
that you download the .csv datafiles.
The supplied .xls spreadsheet may
be used as a template for all your
"working" spreadsheets (save
this downloaded spreadsheet in the
same directory that contains your
downloaded .csv files.
|
|
Let's try it: |
|
► |
We will assume
that you have already set up the
MasterDATAlink program and downloaded
daily data setting either
eSignal or Reuters as your data
vendor in your download list settings.
It is also assumed that Microsoft
Excel is installed on your computer.
|
|
|
|
► |
One of the
datafiles downloaded should be the
Dow Jones
Industrial Average daily
data. The eSignal symbol for
this index is
$INDU.
The Reuters symbol is
.DJI.
For purposes of this illustration,
we shall use the Reuters symbol,
.DJI. The "Demo" MasterDATAlink
downloads this datafile also.
So we are all on the same page. |
|
|
|
► |
Download the Spreadsheet
Template from the MasterDATACSV.com
web site by clicking on the following
link |
| |
|
| |
Download Spreadsheet
Templatee
(for Reuters symbol _DJI.csv
datafile) |
| |
|
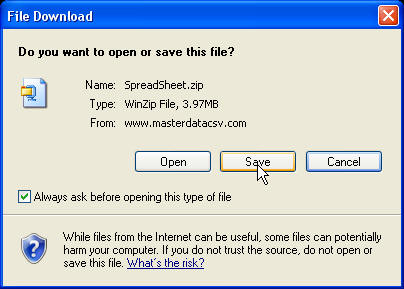
► |
In the dialog that appears,
click on "Save"
|
 |
| |
|
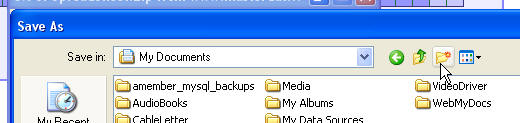
► |
In the next dialog
window that appears ("Save as"),
for this example, create a new folder
called "Temp"
in your "My
Documents" folder.
In actual practice,
you will want this Excel spreadsheet
residing in the same directory as
your downloaded .csv datafiles.
|
 |
|
|
|
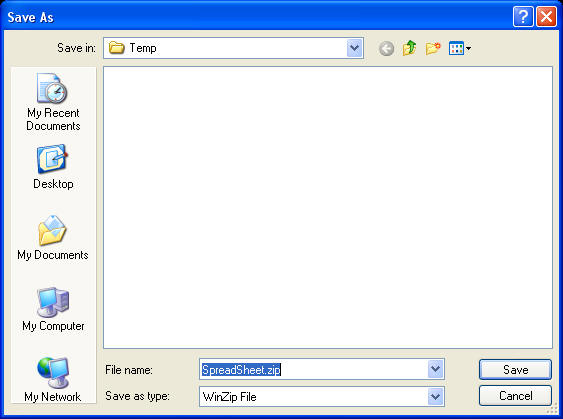
► |
Make sure you are in your new
"Temp" directory.
Click on "Save".
|
 |
|
|
|
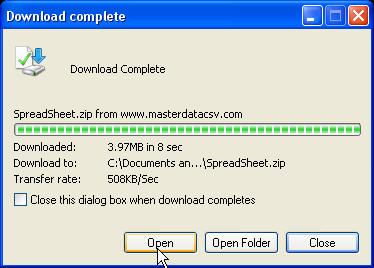
► |
In a few seconds, the "Download
Complete" dialog will
appear.
Click on "Open".
|
 |
|
|
|
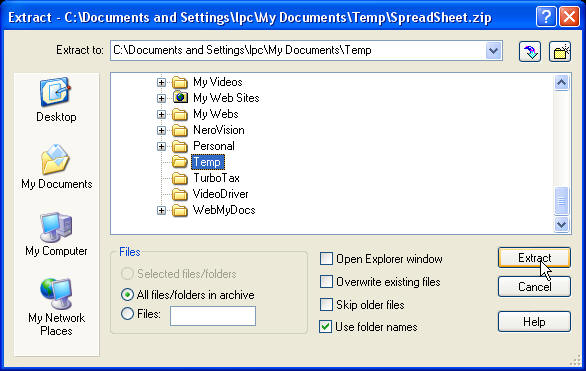
► |
Assuming you are using
WinZip,
this dialog window will appear:
Click on "Extract".
|
 |
|
|
|
► |
Browse to the
new "Temp"
folder in your "My
Documents".
Click on "Extract".
|
 |
|
|
|
► |
Close the WinZip
program window.
|
|
|
|
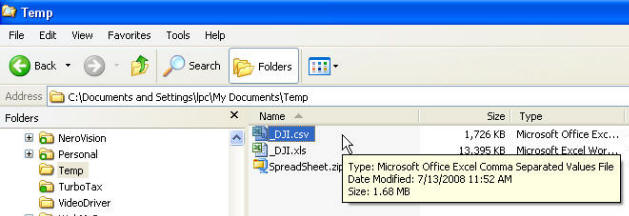
► |
Using Windows
Explorer, go to the "C:\Documents
and Settings\xxx\My Documents\Temp"
directory (where "xxx" is your username):
First open the
file "_DJI.csv".
Once that file is open, then open
the file "_DJI.xls".
It is important to open the files
in this order (.csv first, then
.xls).
|
 |
|
|
|
► |
You should now
have two files opened in Microsoft
Excel, "_DJI.csv"
and "_DJI.xls".
The values displayed in the .xls
file are simply the values it is
reading from your downloaded "_DJI.csv"
file. Every time you download
in the future the Excel .xls file
will reflect the new values of composite
breadth data it reads from the newly
updated or downloaded .csv
file (assuming you always download
to the same directory containing
your .xls spreadsheet).
|
|
|
|
► |
Well, that is
almost true. There is one
more important step that must be
performed in the .xls spreadsheet
file to allow it to properly display
subsequent days of new composite
data. Since your .xls file
is already open, switch to that
file and go to the bottom row of
the spreadsheet (a fast way to get
there is to click somewhere in the
spreadsheet, then while holding
down the "ctrl" key, press the down
arrow key).
|
|
|
|
► |
For purposes
of this tutorial, we have purposely
omitted one row from the bottom
of the .xls spreadsheet. We
are now going to add a new row so
that all of the data contained in
the .csv file will display properly.
|
|
|
|
► |
In the bottom
row of the opened spreadsheet, click
in the column "A" cell. While
holding down both the "Shift"
and "Ctrl"
keys, press the right arrow key.
The entire bottom row of the spreadsheet
should now be highlighted.
|
|
|
|
► |
While holding
down the "Ctrl"
key press the "c"
key (this copies whatever is highlighted
to the clipboard).
|
|
|
|
► |
Now, press the
down arrow key one time making sure
that the cell highlighted is one
row below the last spreadsheet row
and in column "A". Then press
the "Enter" key.
|
|
|
|
► |
You have added
a new line (row) of code to the
bottom of your .xls spreadsheet
that will display the data in the
related row of data in the .csv
datafile. As new days of data
are added to the .csv datafile in
the future, similar to the above,
add more rows to the .xls spreadsheet
to properly display that data.
|
|
|
|
► |
Save your updated spreadsheet (hold
down the "Ctrl"
key and then press the "s"
key).
|
|
|
You can easily "clone" your
.xls spreadsheet to display data
and create
"working" spreadsheets
for all the indexes and ETFs you
download.
|
|
|
|
► |
First, make a
copy of the original .xls spreadsheet
and name it something recognizable
(we use the index or ETF symbol).
For this example lets use "SPY".
So you should now have a newly copied
spreadsheet named "SPY.xls".
|
|
|
|
► |
Using Windows
Explorer, locate and open the file
"SPY.csv"
in your "C:\MasterDATA\CSV\Daily\"
directory. Now open the new
"SPY.xls"
spreadsheet.
|
|
|
|
► |
A Microsoft Excel
dialog will appear. Click
on "Don't
Update". We want our
newly created spreadsheet to link
to the "SPY.csv"
datafile, not "_DJI.csv",
so we need to make some changes
first before worrying about updating
the new spreadsheet.
|
|
|
|
► |
In addition to
anything else you may have opened,
you should also now have open "SPY.xls"
and "SPY.csv".
We are now going to link them up.
|
|
|
|
► |
Switch to the open spreadsheet,
"SPY.xls"
and click on cell "A1"
(top left corner). |
|
|
|
► |
Press the "F2"
key (function key not two letters).
This will allow you to see the underlying
formula of the cell. Identify
the symbol that was utilized in
the prior spreadsheet formulas.
In this case the symbol is "_DJI".
So we now know we need to replace
this symbol with the new symbol
"SPY".
Press the "Esc" key.
|
|
► |
Now, while holding
down the "Ctrl"
key press the "h"
key (this activates the find and
replace Excel function within the
spreadsheet). In this example,
enter "_DJI"
in the "Find
What" text box and "SPY"
in the "Replace
With" text box. Click
on the "Replace
All" button. In a few
seconds all the .xls links have
been modified to point to the downloaded
"SPY.csv"
datafile .
|
|
► |
Save your new "SPY.xls"
spreadsheet. |
Work in
your Excel .xls spreadsheets,
not in the downloaded .csv datafiles.
Your calculations will thereby be
preserved and applied to subsequent
new data as it occurs. The
downloaded .csv datafiles contain
the historical composite data.
The .xls spreadsheet contains and
protects your work. Don't
forget to back it up regularly.
|